HELP!
Click on any of the topics below, or scroll down to view all the help topics. Note that any of the following reports (i.e. Summary, Daily Flows, Monthly Volumes, Measurement Data, and Field Map) can be printed with your web browsers’ (e.g. Google Chrome) built in print feature accessed via the settings menu or with the “Ctrl + P” keystroke.
>Activation
>Login
>Select Date, District, and Field
>Summary
>Daily Flows
>Monthly Volumes
>Measurement Data
>Field Map
>Customize Field Names
>Password Reset
Activation
- Provide an email address for your customer account(s) to your District(s) using the RemoteTracker. Note that if you desire to see either multiple Districts or multiple customer entities in one account, simply provide the same email to each District during the initial FLOW configuration process.
- Once an email has been provided to the District and the accounts have been activated you will receive an email from flow@h2otechonline.com requesting you to define a Name and Password. If you have not received this activation email and you think that you should have, please check your junk/spam email folder. If you still can’t locate the activation email, please contact your District or H2oTech at flow@h2otechonline.com, and the activation email will be resent.
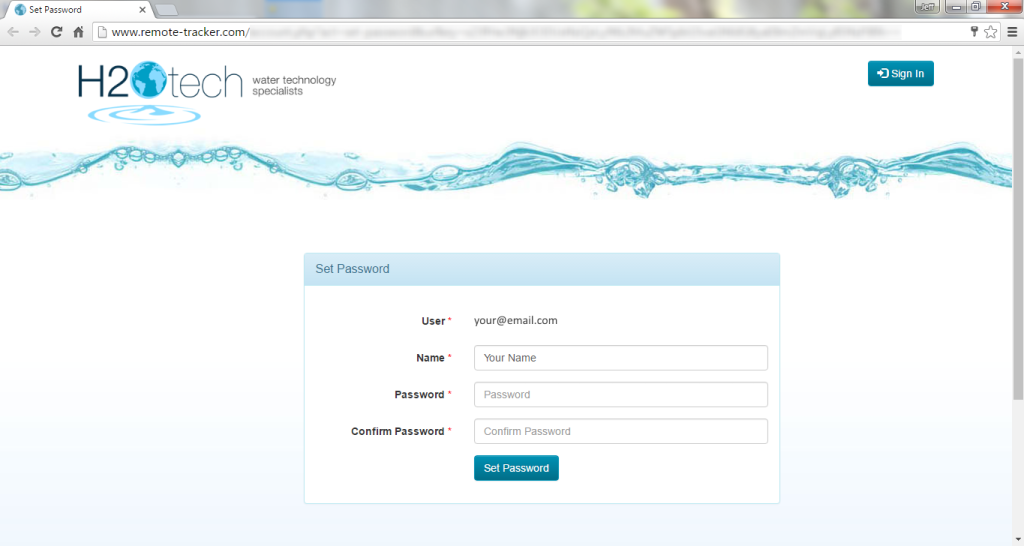
- Follow the link in the activation email and you will see a screen similar to the one shown below.
- Edit your Name as desired.
- Define and confirm user defined Password and click Set Password. You will be returned to the main FLOW login screen.
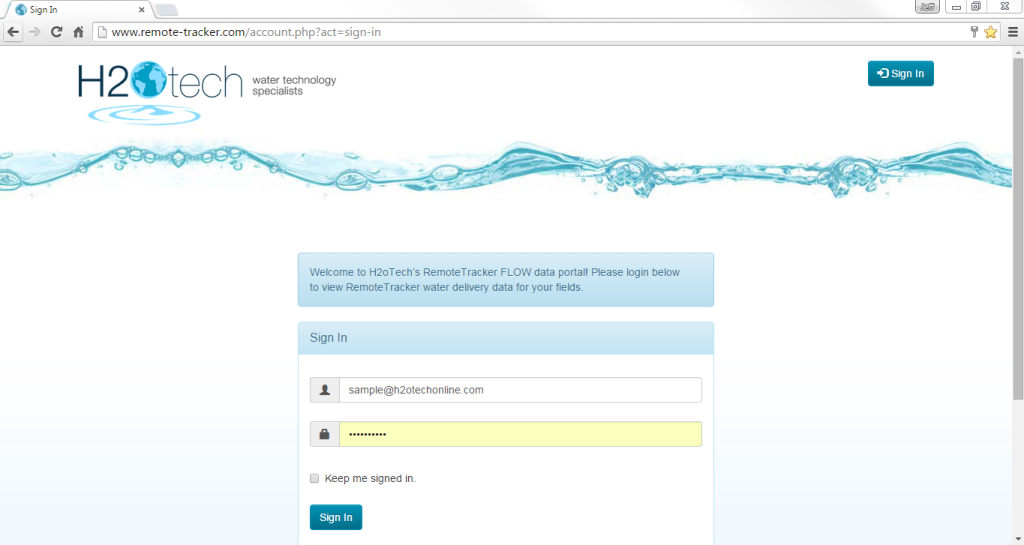
- Enter your email and newly created password and click Sign In to view your data.
Login
- Navigate to FLOW and login with your email and password. See the section above regarding the Activation process if you haven’t activated an account.
- Click Sign In to view your data.
- Password protecting the data ensures that you data is safe.
Select Date, District, and Field
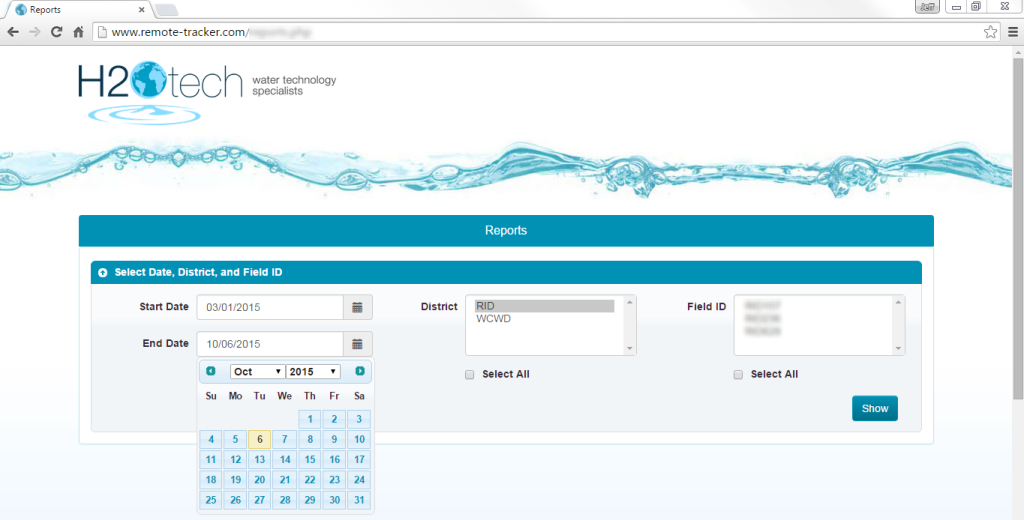
- Once you are logged in, ensure that the “Select Date, District, and Field ID” window is expanded. If it is collapsed, click on the down arrow at the far left of the blue bar.
- Select the Start Date and End Date for the report. By default, the Start Date is set to March 1st of the current year, and the End Date is set to Today. A new Start or End Date can be selected from the calendar picker by clicking on the calendar to the right of the dates displayed.
- Select one or more Districts. If you farm fields in multiple Districts, you can select the “Select All” check box below to select all Districts. Alternatively, you can hold the the control button and left click a custom selection of Districts. Selected Districts will be highlighted blue.
- Select one or more Fields. You can select the “Select All” check box below to select all Fields. Alternatively, you can hold the the control button and left click a custom selection of Fields. Selected Fields will be highlighted blue.
- Once the desired selections have been made, click on “Show” to show the report.
- If you want to make changes to the selections at any time, simply expand the “Select Date, District, and Field ID” window by clicking on the down arrow at the far left of the blue bar.
Summary
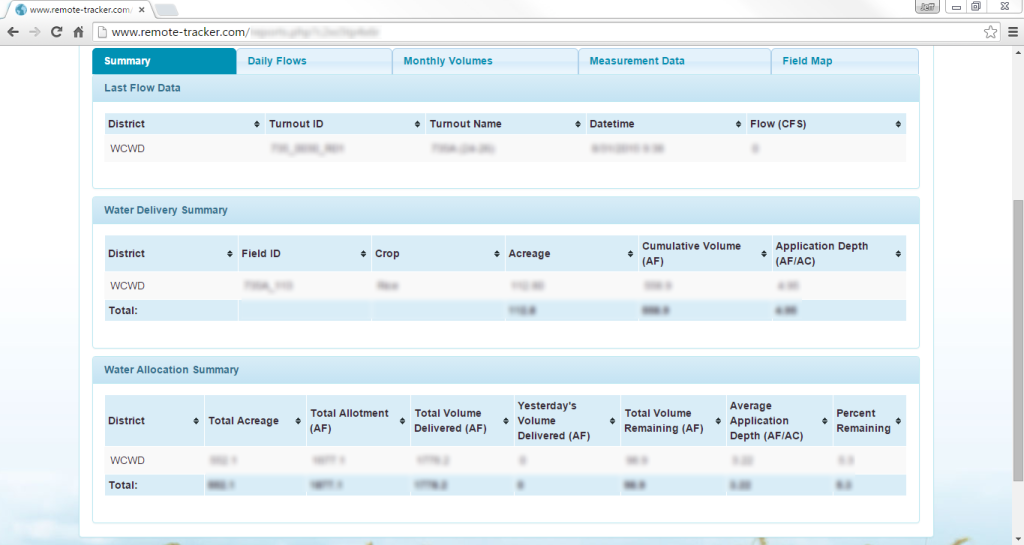
- If one Field is selected, the Summary includes Last Flow Data (Selected Field Only), Water Delivery Summary (Selected Fields(s) Only), and Water Delivery Summary (All Fields). If multiple Fields are selected, only Water Delivery Summary (Selected Field(s) Only) and Water Delivery Summary (All Fields) will be shown.
- In the Last Flow Data (Selected Field Only) section, the District, TurnoutID, Turnout Name, Datetime of the most recent flow measurement, and Flow rate in cubic feet per second (CFS) is shown. All data shown in the Last Flow Data section is updated every 5 minutes.
- In the Water Delivery Summary (Selected Field(s) Only), the District, FieldID, Crop, Acreage, Cumulative Volume delivered in acre-feet (AF), and Application Depth in acre-feet per acre (AF/AC) is shown. All data in the Water Delivery Summary can be sorted by clicking on the small black up/down arrows at the right of each column header shown with a blue background. The total Acreage, Cumulative Volume delivered, and Application Depth is shown at the bottom in bold script with a blue background. All data shown in the Water Delivery Summary section is updated daily. Note that only Fields with measurement data for the time period selected will be shown. In some cases FieldIDs can be selected, but will not appear in this summary because there have not been any measurements for the Field for the selected time period.
- The Water Delivery Summary (All Fields) includes the District, Total Acreage, Total Allotment in acre-feet (AF), the Total Volume Delivered in acre-feet (AF), Yesterday’s Volume Delivered in acre-feet (AF) for the preceding 24 hour period from midnight to midnight, the Total Volume Remaining in acre-feet (AF), the Average Application Depth in acre-feet per acre (AF/AC), and the Percent Remaining of the allocation. In a limited allocation year, the Summary includes District, Total Acreage, Total Allotment (AF), Total Volume Delivered (AF), Yesterday’s Volume Delivered (AF) for the preceding 24 hour period from midnight to midnight, Total Volume Remaining in acre-feet (AF), the Average Application Depth in acre-feet per acre (AF/AC), and the Percent Remaining of the allocation. Regardless of year type, all statistics for this Summary will be for all associated Fields, regardless of whether measurements have been made for the selected time period or not. Therefore, in some instances, the acreage shown for the Water Delivery Summary (All Fields) will be higher than the acreage shown for Water Delivery Summary (Selected Field(s) Only).
Daily Flows
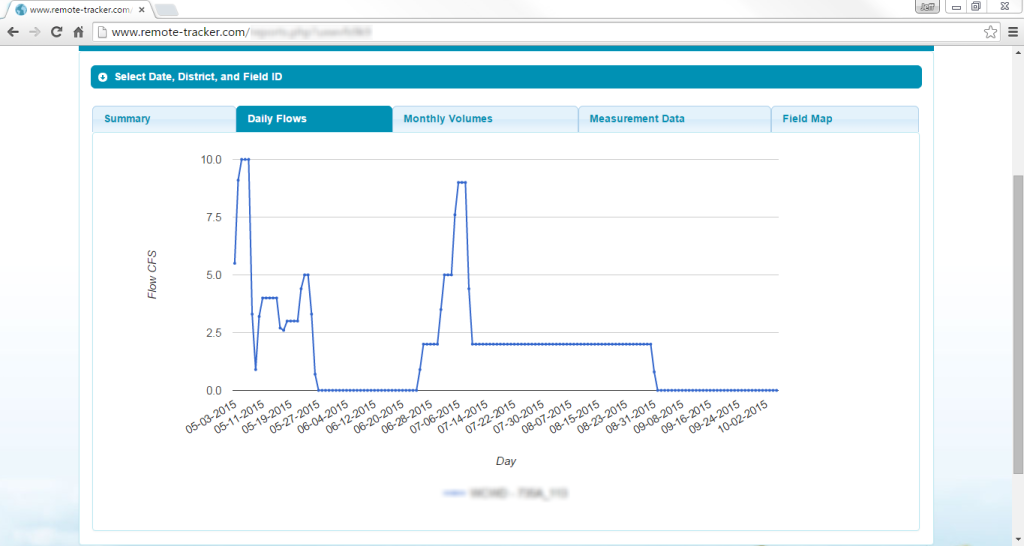
- Click on Daily Flows to view a daily hydrograph.
- The selected Field(s) is shown with time on the x-axis and Flow in cubic feet per second (CFS) on the y-axis.
- Individual flow values can be shown by left clicking on the desired data point.
- A key at the bottom showing the color of the plot with the District and FieldID is shown at the bottom of the graph.
Monthly Volumes
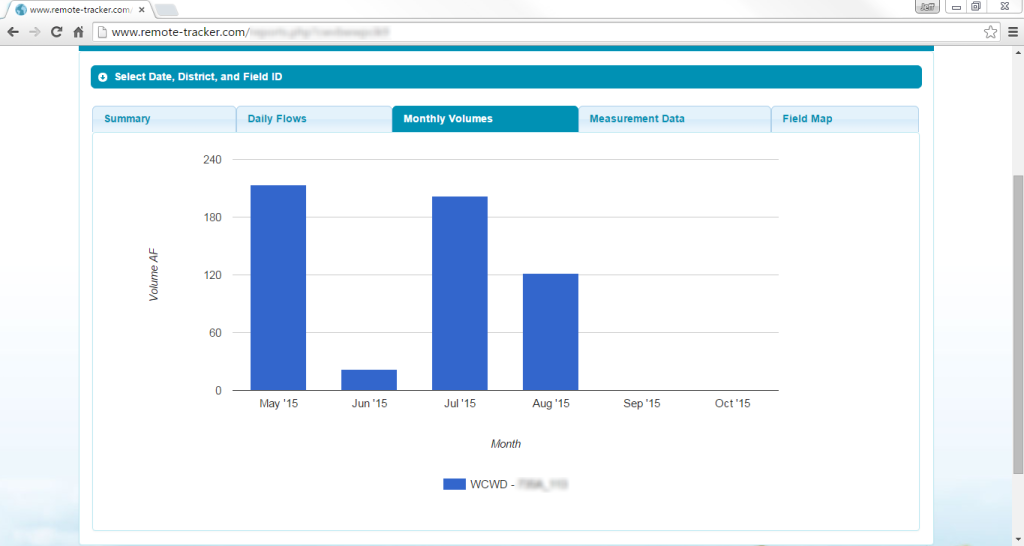
- Click on Monthly Volumes to view a monthly volume summary.
- The selected Field(s) is shown with month on the x-axis and Volume in acre-feet (AF) on the y-axis.
- Individual volume values can be shown by left clicking on the desired data column.
- A key at the bottom showing the color of the plot with the District and FieldID is shown at the bottom of the graph.
Measurement Data
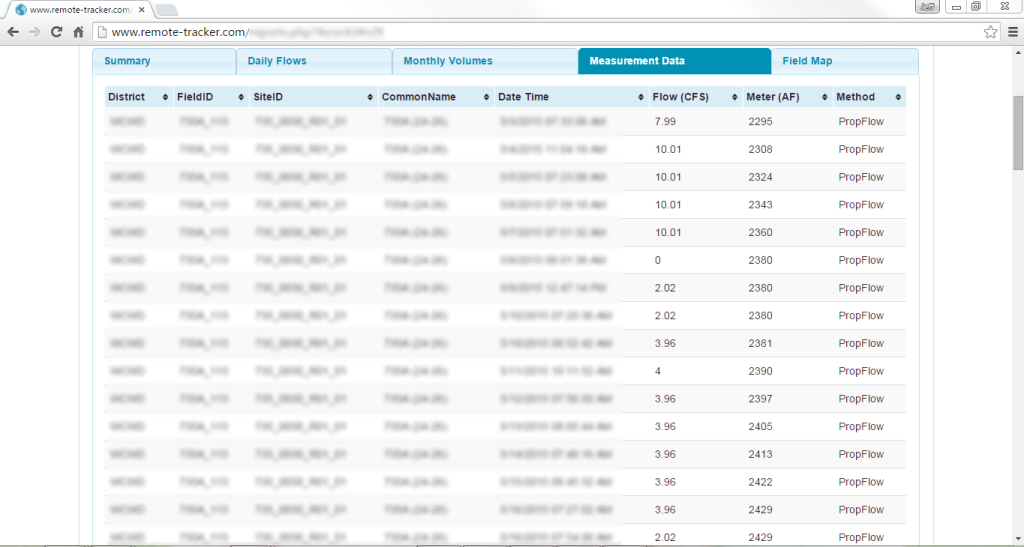
- Click on Measurement Data to view a tabular summary of measurement data. All measurement data used to calculate the data shown on FLOW is shown in the Measurement Data summary.
- All Measurement Data can be sorted by clicking on the small black up/down arrows at the right of each column header shown with a blue background.
Field Map
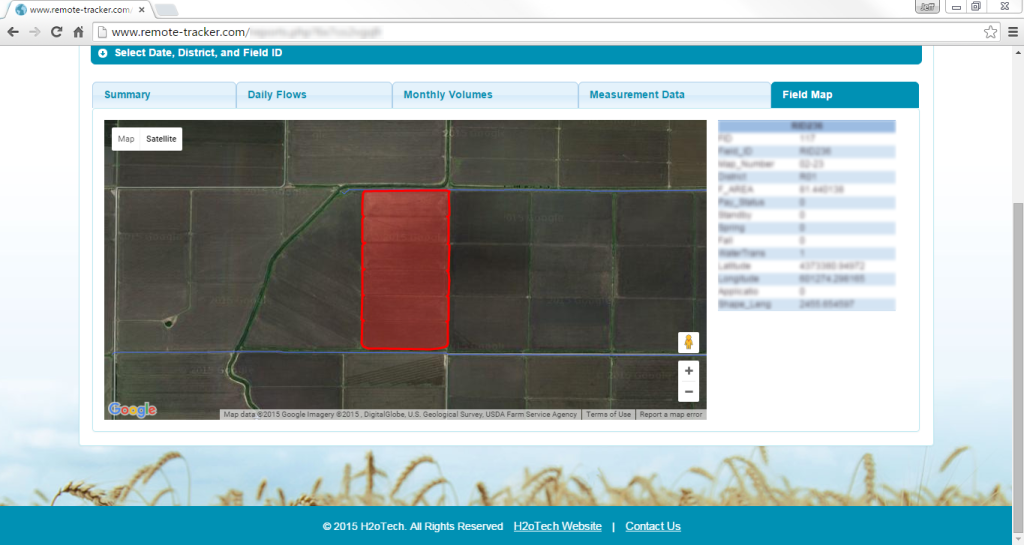
- Click on Field Map to view a map indicating the location of the selected Field(s).
- Google Maps is used to display Field locations, and by default a satellite base is shown. A map base can be shown by clicking on “Map” in the upper left hand corner of the map interface.
- The “+” and “-” buttons on the lower right of the map interface can be used to zoom in and out, respectively.
- All Fields associated with an account are shown in blue, and the currently selected Field(s) are sown in red.
- Additional details about the selected Field(s) can be shown by left clicking on the Fields.
Customize Field Names
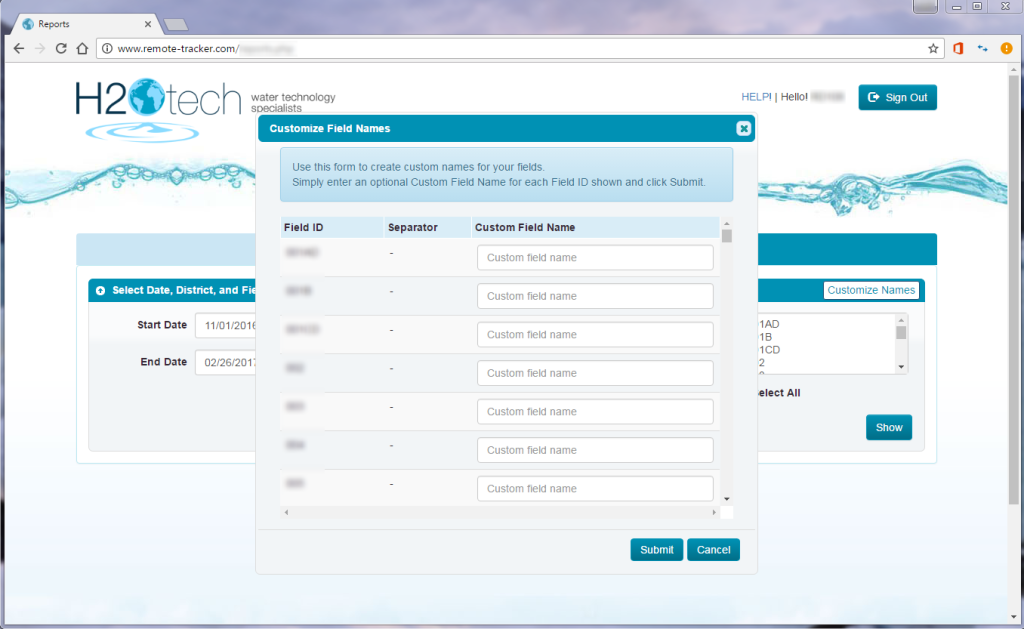
- Click on Customize Names above Field ID selector to open the Customize Field Names window.
- Enter a Custom Name for each Field ID.
- Click on Submit to save Custom Names or Cancel to return to the previous page.
- All references to the Field ID will be updated to show the Field ID, a dash, and then the Custom Name (e.g. “RID123 – Larry’s Field”).
Password Reset
- From the main login page at www.remote-tracker.com click Reset Password.
- Enter the email address associated with your FLOW account, verify that you aren’t a robot, and click Reset.
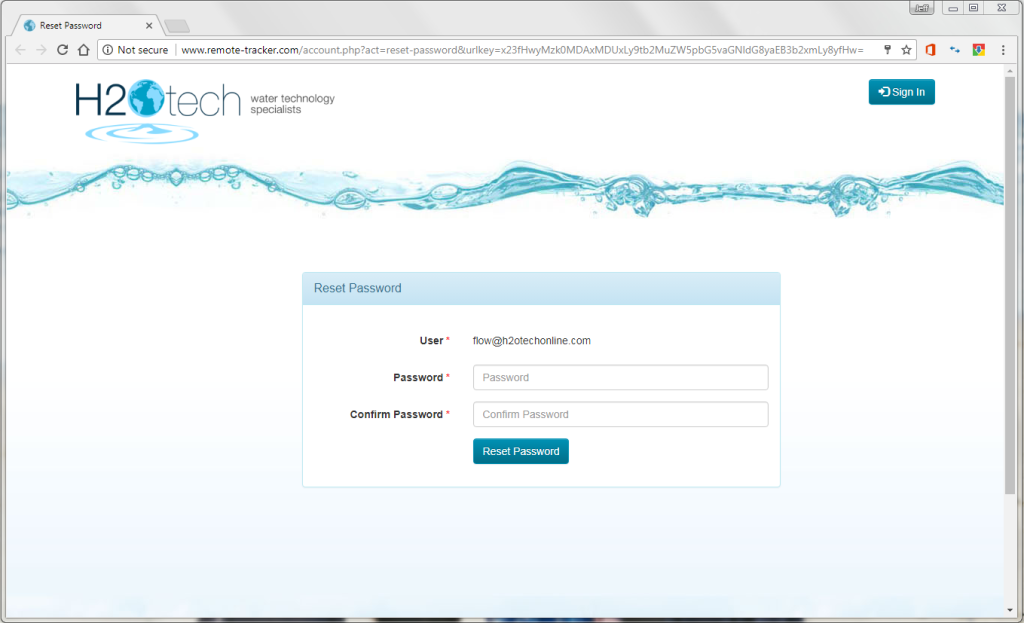
- Within a few moments you will receive a H2oTech Reset Password email from flow@h2otechonline.com. Follow the click here link to enter a new password.
- Enter your new password in the Password and Confirm Password fields and click Reset Password.

